Strait of Hormuz
7 April 2026
Why We Built It
In February 2026, US and Israeli forces launched coordinated strikes on Iran. Within hours, the Strait of Hormuz — the narrow chokepoint through which roughly 20% of the world's oil passes — became the centre of a rapidly escalating conflict. Iran retaliated with drone and missile strikes across the Gulf, hitting targets in the UAE, Qatar, Bahrain, and Saudi Arabia.
We found ourselves refreshing news sites, cross-referencing shipping databases, and hunting for flight trackers — trying to piece together what was actually happening in one of the most strategically critical patches of water on earth. Nothing gave us the full picture in one place.
So we built it.
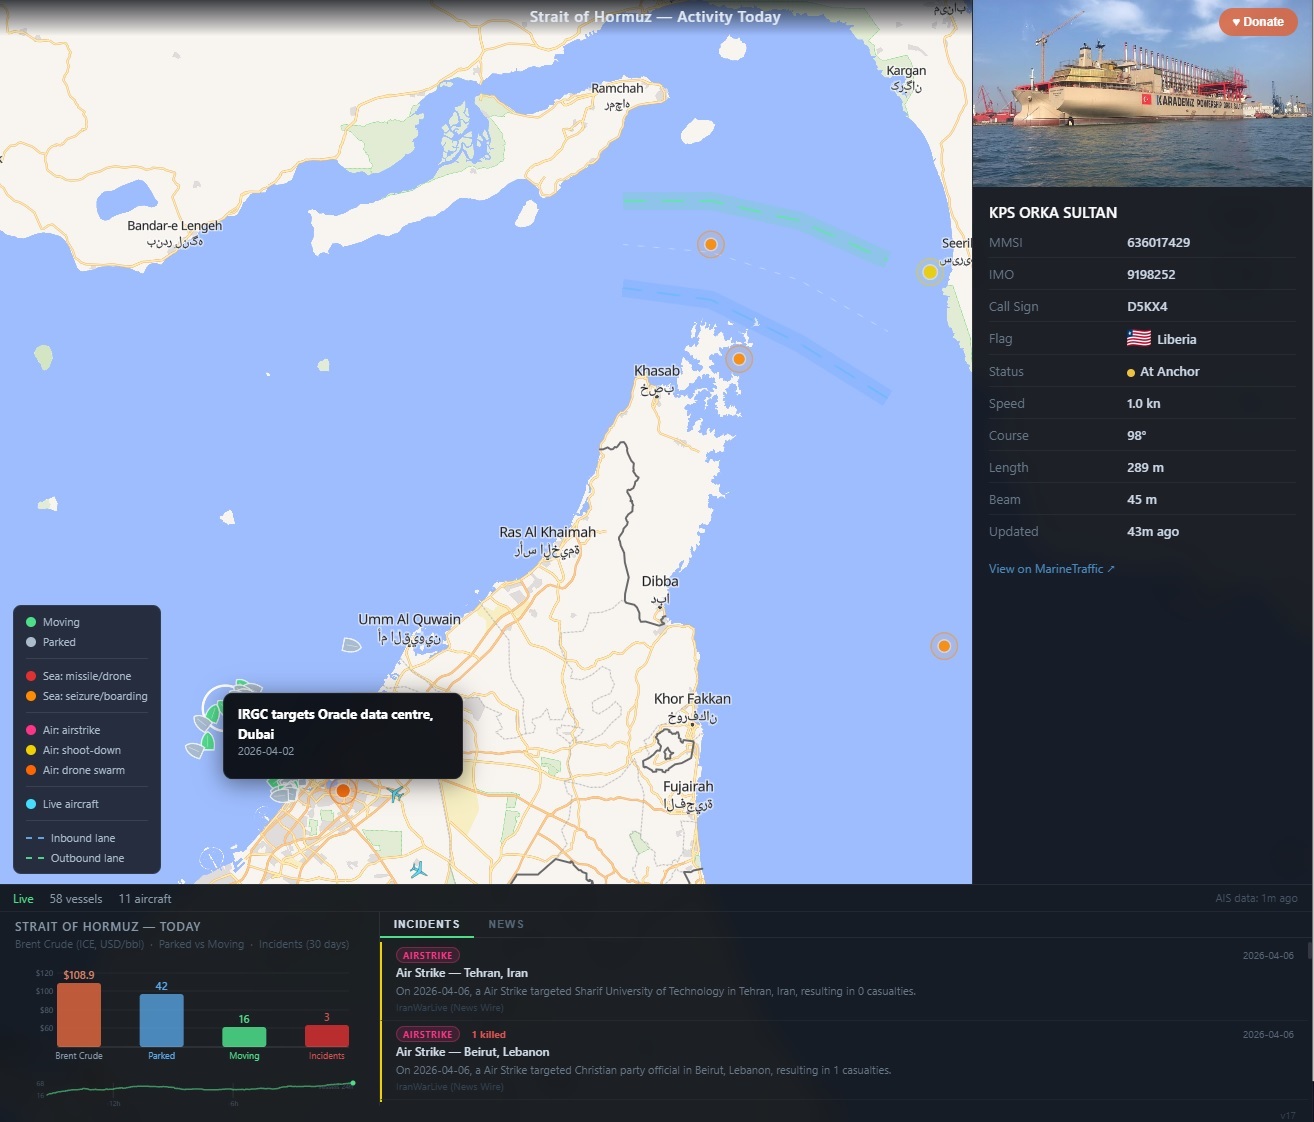
strait-of-hormuz.atodev.xyz is a real-time map showing live vessel traffic, live aircraft, maritime and air incident markers, a news feed, and an oil price — all in one view. It is free, open, and updates continuously.
What the App Shows
Live Ship Traffic
Every vessel in the Persian Gulf, Strait of Hormuz, and Gulf of Oman that is broadcasting an AIS (Automatic Identification System) signal appears on the map as a ship icon. Green icons are moving; grey are parked or anchored. Click any vessel to see its name, flag, type, speed, course, draught, destination, and a photo pulled from MarineTraffic.
Ships leave a faint trail of their last eight positions, making it immediately obvious which direction traffic is flowing — and whether the Strait's traffic separation scheme (inbound lane on the Oman side, outbound on the Iran side) is being followed.
Eight major ports are labelled — Bandar Abbas, Fujairah, Dubai, Jebel Ali, Abu Dhabi, Muscat, Khor Fakkan, Sohar — so you can see at a glance where ships are heading.
Live Aircraft
Every aircraft within 600 km of the Strait appears as a cyan plane icon. The Strait sees a constant mix of commercial airliners, military surveillance aircraft, and tanker flights. Click a plane to see its callsign, altitude, speed, heading, and — where available — a photo from Planespotters.
Incident Markers
Coloured dots mark significant maritime and air incidents going back to 2019:
- Red — missile and drone strikes at sea
- Orange — vessel seizures and boardings
- Pink — air strikes
- Yellow — aircraft shoot-downs
- Dark orange — drone swarms
Click any marker for a full popup: date, description, actors, fatalities, and source. Recent incidents pulse with an expanding ring for ten minutes after they appear.
The incident database covers events including the seizure of the MV Niovi, the MSC Aries boarding by IRGC commandos, the F-15E shoot-down over Iran, the Hormuz closure threat, and the sustained Iranian drone campaign against Gulf states — updated as events develop.
News Feed
A live news tab aggregates filtered headlines from Al Jazeera, BBC Middle East, and Reuters — keywords matched to the Gulf, Iran, Houthis, shipping, and the Strait. Updated every 15 minutes. Each headline links to the full article.
Bottom Panel
A persistent bottom panel shows:
- Status bar — connection state, vessel count, aircraft count, and the age of the AIS data ("AIS data: live" or "AIS data: 3m ago") so you always know if the feed is current
- Bar chart — Brent crude price (ICE futures, live), parked vessels, moving vessels, and incident count (30 days)
- 24h vessel sparkline — a small graph of vessel count over the past 24 hours, showing whether traffic is building or dropping
- Incidents / News tabs — scrollable feed of the most recent events and headlines
How It's Built
The stack is deliberately minimal — no framework, no build step, no database server. Just vanilla JavaScript modules, a handful of Vercel serverless functions, and Vercel KV (Redis) for state.
Frontend
Plain ES modules loaded directly in the browser. The map is MapLibre GL JS with OpenFreeMap Liberty tiles — free, fast, and renders beautifully on both desktop and mobile.
Ship and aircraft icons are drawn programmatically on HTML5 <canvas> at load time — a top-down ship silhouette and a swept-wing aircraft shape — then registered with MapLibre as custom images. No icon files, no sprite sheets.
Incident pulse animations use CSS @keyframes on maplibregl.Marker DOM elements rather than calling setPaintProperty in a requestAnimationFrame loop. That distinction matters: calling paint property setters at 60fps forces MapLibre to recompile its style pipeline every frame, which produces a black screen. The CSS approach is zero-cost.
Shipping lane overlays (the Hormuz Traffic Separation Scheme) are GeoJSON LineString features rendered with translucent fill bands and dashed centrelines. Port labels use MapLibre symbol layers with halo text so they remain readable over any tile style.
Backend
Twelve Vercel serverless functions (the Hobby plan limit):
| Endpoint | Purpose |
|---|---|
| collector.js | Cron — runs every minute, listens to AISStream WebSocket for 55 seconds, writes vessel positions to KV |
| vessels.js | Serves KV snapshot to the browser; CDN-cached 14s |
| vessel-extra.js | Vessel trails and 24h count history from KV |
| ais-stream.js | SSE proxy — direct AIS stream for power users |
| aircraft.js | Proxies adsb.lol ADS-B feed (600km radius from Strait) |
| incidents.js | Curated maritime incidents 2023–2026 |
| air-incidents.js | Curated air incidents 2019–2026 |
| acled.js | IranWarLive live OSINT feed, with KV persistence so events survive outages |
| news.js | RSS aggregator — Al Jazeera, BBC, Reuters filtered by keywords |
| oil-price.js | Brent crude from Yahoo Finance (ICE BZ=F futures) |
| ais-key.js | AIS API key proxy |
| credentials.json | OpenSky credentials (gitignored) |
AIS Data Pipeline
AIS (Automatic Identification System) is the VHF radio standard all commercial vessels use to broadcast their position, speed, course, and identity every few seconds. AISStream.io aggregates these signals globally via a WebSocket API.
The key architectural decision was to use a cron-based collector rather than a persistent connection. Vercel serverless functions can't hold a WebSocket open indefinitely. Instead, a cron job fires every minute, opens the WebSocket, subscribes to three bounding boxes covering the Gulf/Strait/Oman region, collects for 55 seconds, writes all received positions to Vercel KV, then closes. The browser polls /api/vessels every 15 seconds — which is just a KV read, cheap and CDN-cacheable.
GPS spoofing is endemic near the Strait — Iran routinely broadcasts false positions to confuse navigation. We filter this with water-zone validation: any position that falls outside defined maritime rectangles (covering the Persian Gulf, Strait, Gulf of Oman, and UAE east coast) is discarded before being stored to KV, both server-side in the collector and client-side before rendering.
Vessel trails are built by appending the previous position to a trail array in KV before overwriting lat/lon on each update — up to eight positions, giving roughly eight minutes of track history.
Aircraft Data
We initially used OpenSky Network with OAuth2 client credentials, but the research API required manual approval. We switched to adsb.lol — a free, no-auth community ADS-B aggregator — which returns all aircraft within a configurable radius. 600 km centred on 26°N 57°E covers the entire region cleanly.
Deployment
The entire app is a single Vercel project. Deployment is vercel --prod from the terminal — typically takes 13–15 seconds from commit to live. No build step, no CI pipeline, no Docker. The vercel.json configures cron schedules; environment variables (AISStream API key, KV connection strings) are set in the Vercel dashboard.
Vercel KV (managed Redis) stores:
vessels— current vessel map, 2-hour TTLvessel_types— static vessel data (type, dimensions), 24-hour TTLvessel_history— 24h of count snapshots, 25-hour TTLiranwarlive_incidents— persisted OSINT events, 90-day TTL
Total infrastructure cost: $0/month on Vercel's Hobby plan. The only paid component would be if AISStream usage exceeds the free tier.
What We Learned
The Strait is surprisingly busy even during a war. Traffic dropped sharply in early March 2026 but recovered faster than expected — tankers rerouted, insurers repriced, and commerce adapted. The vessel count chart tells that story more clearly than any news article.
GPS spoofing is constant. Before we added water-zone filtering, dozens of vessels appeared over the UAE desert and deep in Iranian mountains. Iran's electronic warfare apparatus is always active.
Free data is good enough. AISStream free tier, adsb.lol, Yahoo Finance, OpenFreeMap, and RSS feeds from major news organisations give you a surprisingly complete operational picture at zero cost.
Serverless constraints force good architecture. The inability to hold a persistent WebSocket on Vercel forced the cron+KV pattern, which turned out to be more scalable than a persistent connection — thousands of users hit a CDN-cached endpoint rather than a single WebSocket proxy.
What's Next
- Port-specific vessel counts (how many ships are anchored off Fujairah vs transiting)
- ACLED integration (richer conflict data with coordinates)
- Mobile PWA / home screen install prompt
- Historical incident timeline view
Built with MapLibre GL JS · OpenFreeMap · AISStream · adsb.lol · Vercel
Takeaway
The app is live at strait-of-hormuz.atodev.xyz. It updates continuously. If you see something wrong or missing, the data pipeline is always improvable.